
Because Americans are conditioned to relate any piece of news to whatever part of the permanent campaign we’re enmeshed in, there’s been a lot of loose talk about how the deplorable attacks in Paris will upend the 2016 presidential race. As Dartmouth political science professor Brendan Nyhan points out, that’s overblown, especially so far from Election Day. Even “game-changers” right before an election—like the ever-present promise of an “October surprise”—rarely move the needle.
To the extent that real-world events can intrude on partisan loyalties and impact elections, the economy is a key data point. In 2012, three political scientists helped Ezra Klein build an election model with only three factors: whether either candidate is an incumbent, where the president’s approval rating sits in June of the election year, and the change in gross domestic product (GDP) in the first three quarters of that year. This model correctly predicted the popular vote within one-tenth of a percentage point.
Economic models are not always that perfect, but they provide information that can help predict an election outcome. If the economy is doing well, the theory goes, an incumbent president’s party has a leg up. If it staggers, the opposition party has a credible argument for new leadership.
So how is 2016 shaping up? President Obama’s approval rating in the latest Gallup poll is around 49 percent, neither popular nor unpopular. There will be no sitting president on the ballot, diminishing the Democrats’ incumbency advantage. That makes GDP growth a major variable.
I asked John Sides of George Washington University, co-creator of that election model for Ezra Klein, to plug in some numbers. He said that, under his model, if the economy grew by 1 percent in the given time frame, Democrats would have a 47 percent chance of victory. If it grew by 2 percent, that jumps up to 65 percent.
Sides put a ton of caveats on those numbers, saying that candidate quality, the “time for a change” factor of one party holding the presidency for multiple terms, and many other things can affect the outcome. “At this point, the upshot is an election that’s pretty close to 50-50,” Sides said. But a recession, or even a slow-growth economy where people feel struggle, looms large in this analysis.
Fortunately for Democrats, the Federal Reserve predicts 2016 growth at 2.4 percent, in line with other economists’ projections. Unemployment has fallen to the lowest rate in seven years. With threats of a debt-limit default or government shutdown (mostly) contained, self-inflicted wounds from Washington are unlikely. At first glance, the economy appears to be in a decent position to chug along or even improve—and bode well for the Democrats in 2016.
But that first look may be
deceiving. When I want to understand future economic trends, one of my primary
sources is Dean Baker of the Center for Economic and Policy Research, the
economist most associated with calling the housing bubble years before everyone else. And when I checked in
with him this week, Baker was worried. In particular, he pointed to what could
prove to be the most obscure, yet important, statistical chart in determining the election.
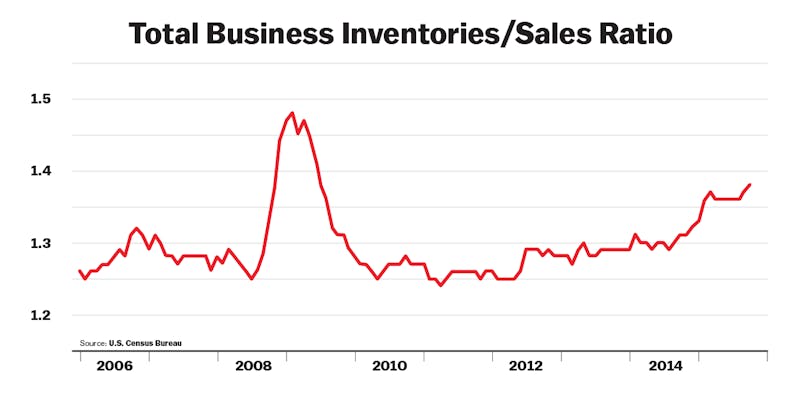
The chart measures the ratio between business inventories and sales. A higher ratio means that inventory is building up nationwide; a lower ratio means that consumers are snapping up goods as fast as they’re being produced.
To summarize the findings, businesses are currently stuffed to the gills with un-bought goods. “We have seen an extraordinary run-up in inventories in the last few months,” Baker said via email. The inventory/sales ratio is at its highest level since the middle of 2009, around the end of the last recession.
That could mean companies are stocking up before the holiday shopping season; indeed, polls show that Americans are planning to buy more Christmas presents this year than at any time since 2007. But Baker believes something more fundamental—and troubling—is going on. He thinks that lack of sales has caused all this extra stuff to sit around. When inventories are too large, businesses stop making new products until they draw those inventories down. As a result, according to Baker, “we should expect a cutback in production in the months ahead,” which means fewer manufacturing jobs and less contribution to GDP growth.
Other figures back up this troubling inventory buildup. Retail sales have been flat for the past three months, as spending on education and healthcare eats into discretionary income. The October Small Business Optimism Index from the National Federation of Independent Businesses remains below average; in particular the sales and labor market data showed up weak. And port traffic nationwide has slowed, with reductions in imports during peak shipping season for the first time in a decade. So this isn’t a matter of businesses stocking too many goods; they’re not even able to sell out a relatively slow trickle.
Not only are imports down, but domestic manufacturing activity is also on the decline, as is overall industrial production. That reflects weak growth in China (which roiled the stock markets over the summer) and the stronger dollar, which makes U.S. exports more expensive.
Baker showed me some other bad economic indicators, separate from the inventory problem. The office vacancy rate climbed to 16.5 percent this year, a high historical figure, and yet this comes amid an expansion in commercial real estate (CRE). Retail space also remains stagnant. Baker worries that this could point to a bubble in the CRE sector. “Demand is not collapsing, but probably does not justify the rate of building that we are seeing,” he said.
Baker doesn’t believe a
recession is imminent. But if you combine the inventory glut, what it says
about sales, the effect on manufacturing jobs, and a possible crash for
commercial real estate, he believes that GDP growth could slow from a little
over 2 percent to “closer to 1 percent for the year.” He added that his
final estimate could come in a bit higher.
How would low growth in 2016 affect the presidential election? Baker’s estimate of 1 percent GDP growth lays right along the political-science dividing line, where Democrats shift from being favored to win the presidency to being slight underdogs. Despite the millions of jobs created in President Obama’s second term, a stinker of a final year would color people’s perceptions, and make it difficult for the Democratic candidate.
There’s not much to be done between now and the election to change the economic trajectory. Republicans control Congress and have no interest in—or incentive toward—programs that spend money and stimulate growth. The budget deal commits the government to slightly higher spending, but not enough to reverse any trend.
Slow global growth only compounds the problem; earlier this week, Japan slipped into recession, an example of the contagion from lower growth in China. Even if you think the Trans-Pacific Partnership would lead to a trade surge (I don’t), it cannot be implemented until at least 2017, if it passes at all.
At the least, the data should give the Federal Reserve pause as they plan to raise interest rates for the first time in nearly a decade. One small rise won’t hurt much, but a “return to normalcy” of several incremental hikes could be trouble.
It’s important to note that slow growth in 2016 is not a consensus view among economists. You can envision a scenario where a banner holiday season depletes inventories, where job growth finally leads to higher wages, where consumers finally use the extra cash from low gas prices—and where any fears blow over. But if a generally on-target economist like Baker sees a low-growth story unfolding in 2016, it’s hard to completely dismiss it. And that should raise alarm bells at DNC headquarters.